Finding Reasonable Limit Orders with Pandas, Plotly and Streamlit
Earlier this year, I had a lump sum that became available for investment: The money had been a long-term investment which had been kicked off by my parents literally decades ago. The conditions were quite favorable for a long time, until they weren’t: I pulled the plug and decided to use the money differently. I wanted to make a one-time purchase of the ETFs for which I had already long-running purchase plans - but I was not in a hurry and wanted to get a good price. 💸
At the same time, I had some other stocks that I want to sell - but again this was not urgent and I was fine with keeping them another few months if I could get a better price. 💸
Limit orders are an obvious solution to these problems: It’s easy to set up a buy order that would only be executed if the price falls below a certain threshold, or a sell order that only gets executed if the price is above a certain threshold. (If the price does not reach this limit, the order is not executed.) But a crucial question remains: Which price should I provide as a limit? 🤔
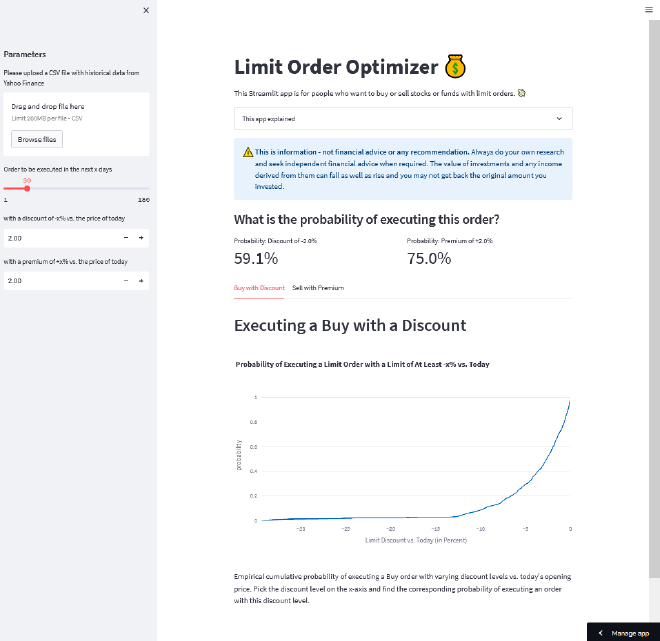
To solve this problem, I wrote a little piece of software that I called limit order optimizer: It calculates the probability of executing a limit order in a given time window and with a given discount/premium based on historical data. For example, it’s possible to see the probability for executing an order with a discount of -2% vs. today’s price in the next 30 days (or -2.5% in the next 40 days, …). Also, it’s possible to see the empirical cumulative density of probabilities for different levels of discount - in other words, what is the probability of having a discount of at least x%.

By default, the dashboard shows the data for the UBS MSCI World SRI ETF (ISIN LU0629459743), but it’s possible to ingest the CSV files that are exported by Yahoo Finance or other data providers as long as they have a date and the opening price, highest price and lowest price for each day.
I am using this to create orders where I get a nice price but still have a decent chance of being executed. Nice price and decent chance are still vague terms and require human judgment: Is 60% probability good enough, or am I willing to buy at a slightly higher price to get to a probability of 70%? But at least the whole thinking becomes more data-driven instead of me looking at today’s price and simply guessing what the future might bring.
I wrote the code during a few evenings and lazy weekend afternoons. It’s now available on Github. ⭐ It’s written in Python 🐍 , with a bit of data processing in pandas, a few plots in plotly (which I really love) and a front-end in streamlit. It’s hosted on the streamlit public cloud.
I had seen streamlit a while ago and it looked really exciting - now I’m glad I found a way of toying around with it. It’s relatively easy to get started and to define simple apps. Writing code from scratch was not always super-intuitive, but I started writing a minimal example in a Jupyter Notebook and then transformed it into a streamlit app with more variable parameters. The integration with other visualization libraries is great: It was extremely easy to take an existing plotly chart and having it show up in my streamlit dashboard. All in all, a very enjoyable experience and I can definitely see myself building more complex examples.
At the time of this writing, I am still waiting for the limit orders to be executed. (This is a good sign: Setting up a too tight limit would increase the probability that they get executed quickly, but would also be a sign that I’m leaving money on the table because I am not patient enough.) But already the process of building the app was fun!
